| Propagation - International
Marconi Day from UK G0KYA, Steve Nichols 24/04/2010 steve@infotechcomms.co.uk |
How to read the charts
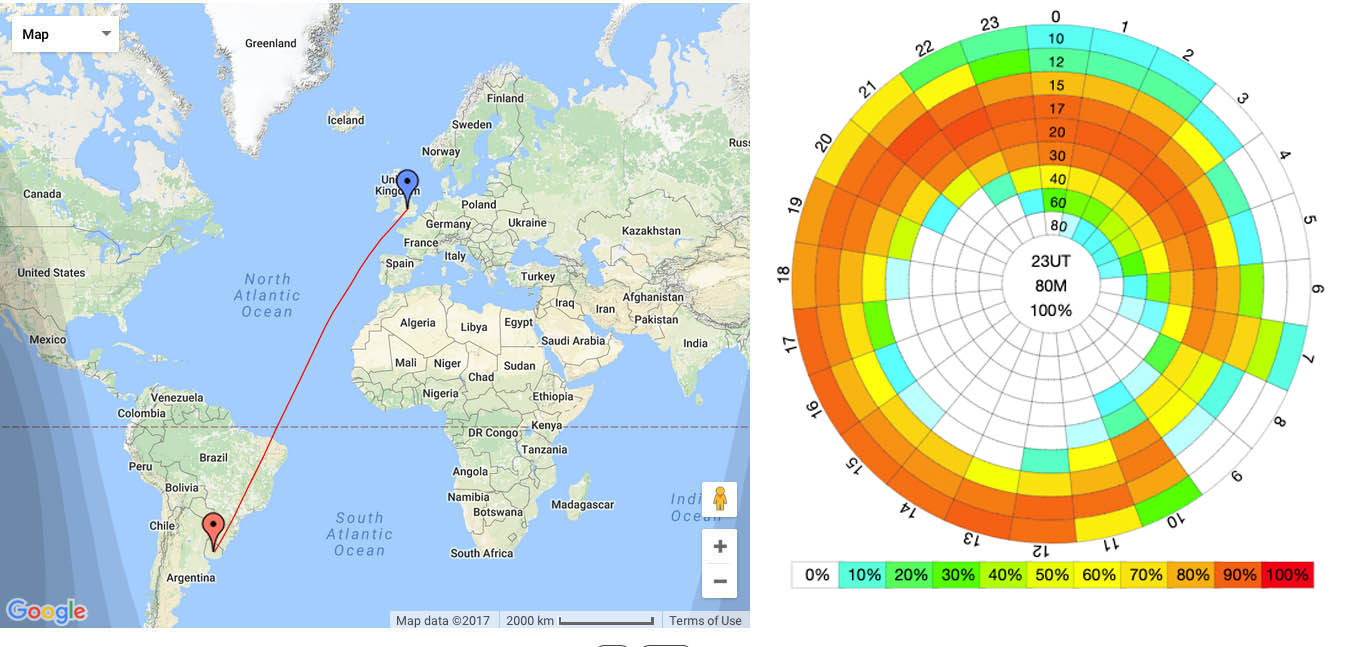
The chart shows the best frequency to use if working from the UK to each area. The dark green (squares) plot shows the optimum frequency and the light green plot shows the next best frequency to use. The dark green blob plot shows the reliability of the path as a percentage that it is likely to be open.These are based on CW, 100W, dipole to dipole and a "fair" reception. Adjust the reliability according to your own station.
For more general charts see http://www.infotechcomms.net/propcharts/

Uruguay
Reliability/Band graph produced by WinCap Wizard/VOACAP
Tough one this. Reliability is never better than 30%. Look at 20m (14MHz) at night. Chart suggests
possible 24/28MHz openings
during the afternoon, but don't hold your breath!